
A cash flow forecast projects money in and out month by month using one repeating line - opening balance plus cash in minus cash out equals closing balance. Build a 12-month view from your current bank balance, enter revenue in the month the cash actually lands rather than when you invoice, split spending into fixed, variable, and one-off, then read the closing balances and cash runway to see which months dip toward zero. The point is to catch a shortfall months ahead, while there is still time to act.
A profitable business can still run out of cash. That is the core problem cash flow forecasting solves.
Profit tells you whether revenue exceeds expenses over time. Cash flow tells you whether there is enough money in the account to pay this week’s bills. Both matter, but cash flow is the one that keeps the lights on.
Ready-made template: The Cash Flow Forecast Template provides a 12-month structure with built-in formulas for projections, scenario planning, and automatic balance calculations.
What Is Cash Flow Forecasting?
A cash flow forecast is an estimate of money coming in and going out of your business over a future period - usually 12 months.
It answers a simple question: will there be enough cash to cover obligations at any given point?
Unlike a profit and loss statement, which can include non-cash items like depreciation and accrued revenue, a cash flow forecast only tracks actual money movement. When a customer pays, that is cash in. When rent is due, that is cash out.
Cash Flow vs. Profit
These two concepts are related but distinct.
| Cash Flow | Profit | |
|---|---|---|
| What it tracks | Actual money in and out | Revenue minus expenses |
| Timing | When money moves | When transactions are recorded |
| Includes | All cash movements (loans, owner draws, tax payments) | Only revenue and business expenses |
| Time horizon | Week by week or month by month | Usually monthly, quarterly, or annual |
| Key question | Can we pay the bills? | Is the business earning more than it spends? |
A business might show a profit on paper while struggling to meet payroll. This often happens when customers pay on 30, 60, or 90-day terms. The revenue is booked, but the cash has not arrived yet. Meanwhile, suppliers and employees still need to be paid.
Why Cash Flow Forecasting Matters for Small Businesses
Large companies have credit lines and reserves to absorb cash timing gaps. Small businesses typically do not, which is one reason cash flow ranks among the financial pressures tracked in the Federal Reserve’s Small Business Credit Survey.
Some common situations where a forecast helps:
- Seasonal fluctuations - a landscaping company earning most revenue in spring and summer still has winter expenses
- Late-paying customers - invoices outstanding for 60+ days while fixed costs keep coming
- Growth spending - hiring new staff or buying equipment before the additional revenue arrives
- Tax obligations - quarterly estimated tax payments that can catch business owners off guard
- Loan repayments - regular debt payments that reduce cash but may not show as expenses on a P&L
A forecast turns these from surprises into planned events.
The Basic Cash Flow Formula
Every cash flow forecast builds on this formula:
Opening Balance + Cash In - Cash Out = Closing Balance
The closing balance for one month becomes the opening balance for the next. That is the entire structure - repeated month after month.
| January | February | March | |
|---|---|---|---|
| Opening Balance | $15,000 | $12,500 | $14,200 |
| Cash In | $22,000 | $25,000 | $23,000 |
| Cash Out | $24,500 | $23,300 | $21,800 |
| Closing Balance | $12,500 | $14,200 | $15,400 |
In this example, January shows more going out than coming in - but the opening balance covers the gap. This is exactly the kind of pattern a forecast reveals. Without it, that January dip could cause panic.
How to Project Revenue
Revenue projections are the hardest part. Some approaches that work:
Use Historical Data
If the business has been running for a year or more, past revenue is the starting point. Look at month-by-month revenue for the previous 12 months. Identify seasonal patterns, growth trends, and anomalies.
Three-Scenario Approach
Rather than picking a single number, some business owners find it useful to estimate three versions:
| Scenario | Assumption | Monthly Revenue Example |
|---|---|---|
| Conservative | Slow month, lost clients, delays | $18,000 |
| Expected | Based on current trends and pipeline | $23,000 |
| Optimistic | New clients land, growth continues | $28,000 |
The expected scenario drives the main forecast. The conservative scenario shows what happens if things slow down. More on this in the scenario planning section.
Factor in Payment Timing
Revenue is not the same as cash received. If customers pay on net-30 terms, January’s sales become February’s cash. This timing gap is one of the most common sources of cash flow problems.
For the forecast, enter revenue in the month the cash actually arrives - not when the invoice is sent.
Weight Uncertain Pipeline Revenue
Not all projected revenue carries the same certainty. Signed contracts and active retainers are dependable. Work still sitting in the sales pipeline is not. One approach that keeps projections grounded is to apply a probability multiplier to unsigned work, based on how often similar deals have closed in the past.
A services firm might separate its inflows like this:
| Inflow source | Jun | Jul | Aug | Sep | Oct | Nov |
|---|---|---|---|---|---|---|
| Retainer client A | $6,000 | $6,000 | $6,000 | $6,000 | $6,000 | $6,000 |
| Retainer client B | $4,500 | $4,500 | $4,500 | $4,500 | $4,500 | $4,500 |
| Project work (signed) | $12,000 | $8,000 | $5,000 | $0 | $0 | $0 |
| Pipeline (60%) | $0 | $4,000 | $8,000 | $12,000 | $9,000 | $6,000 |
| Total inflow | $22,500 | $22,500 | $23,500 | $22,500 | $19,500 | $16,500 |
The pipeline row multiplies the value of open opportunities by an expected close rate, 60 percent in this example. Businesses without a track record often start with a lower figure and raise it as real conversion data accumulates. Keeping signed and unsigned revenue on separate rows makes it easy to see how much of the forecast rests on work that has not been won yet.
Fixed vs. Variable Expenses
Expenses fall into two broad categories, and separating them makes forecasting more accurate.
Fixed Expenses
These stay roughly the same regardless of how much revenue comes in:
- Rent or lease payments
- Salaries (for permanent staff)
- Insurance premiums
- Loan repayments
- Software subscriptions
- Accounting and legal retainers
Fixed expenses are the easy part of forecasting. They are predictable and change infrequently.
Variable Expenses
These fluctuate with business activity:
- Materials and supplies
- Contractor or freelancer payments
- Shipping and delivery costs
- Sales commissions
- Marketing spend (if tied to campaigns)
- Utilities (partially variable)
Variable expenses are harder to predict but tend to track with revenue. If revenue drops, many variable costs drop too - which provides a natural buffer.
One-Off Expenses
Some costs do not repeat but still need to appear in the forecast:
- Equipment purchases
- Office fit-out or renovation
- Annual license renewals
- Tax payments (quarterly or annual)
- Seasonal inventory stocking
Missing one-off expenses, the kind covered in budgeting for irregular expenses, is a common reason forecasts turn out to be overly optimistic.
Building a 12-Month Forecast: Step by Step
Step 1: Set Your Opening Balance
Check the current business bank balance. That is the starting point.
Step 2: List All Revenue Sources
Break revenue into categories that make sense for the business:
- Product sales
- Service revenue
- Recurring/subscription revenue
- Other income (interest, refunds, grants)
Step 3: List All Expenses
Use bank statements and accounting records from the past 12 months. Group them into fixed, variable, and one-off categories.
The Monthly Expense Tracker can help organize expense categories and identify spending patterns from historical data.
Step 4: Enter Monthly Projections
Fill in each month with projected amounts. A 12-month view might look like this:
| Category | Apr | May | Jun | Jul | Aug | Sep | Oct | Nov | Dec | Jan | Feb | Mar |
|---|---|---|---|---|---|---|---|---|---|---|---|---|
| Opening Balance | $20,000 | $18,200 | $19,700 | $22,100 | $20,600 | $19,100 | $21,300 | $23,000 | $24,500 | $18,800 | $17,300 | $19,800 |
| Revenue | $30,000 | $32,000 | $35,000 | $33,000 | $31,000 | $34,000 | $36,000 | $35,000 | $28,000 | $30,000 | $33,000 | $35,000 |
| Fixed Expenses | $22,000 | $22,000 | $22,000 | $22,000 | $22,000 | $22,000 | $22,000 | $22,000 | $22,000 | $22,000 | $22,000 | $22,000 |
| Variable Expenses | $8,500 | $7,500 | $9,200 | $11,000 | $9,000 | $8,300 | $10,800 | $10,000 | $10,200 | $8,000 | $7,000 | $8,500 |
| One-Off Expenses | $1,300 | $1,000 | $1,400 | $1,500 | $1,500 | $1,500 | $1,500 | $1,500 | $1,500 | $1,500 | $1,500 | $1,500 |
| Closing Balance | $18,200 | $19,700 | $22,100 | $20,600 | $19,100 | $21,300 | $23,000 | $24,500 | $18,800 | $17,300 | $19,800 | $22,800 |
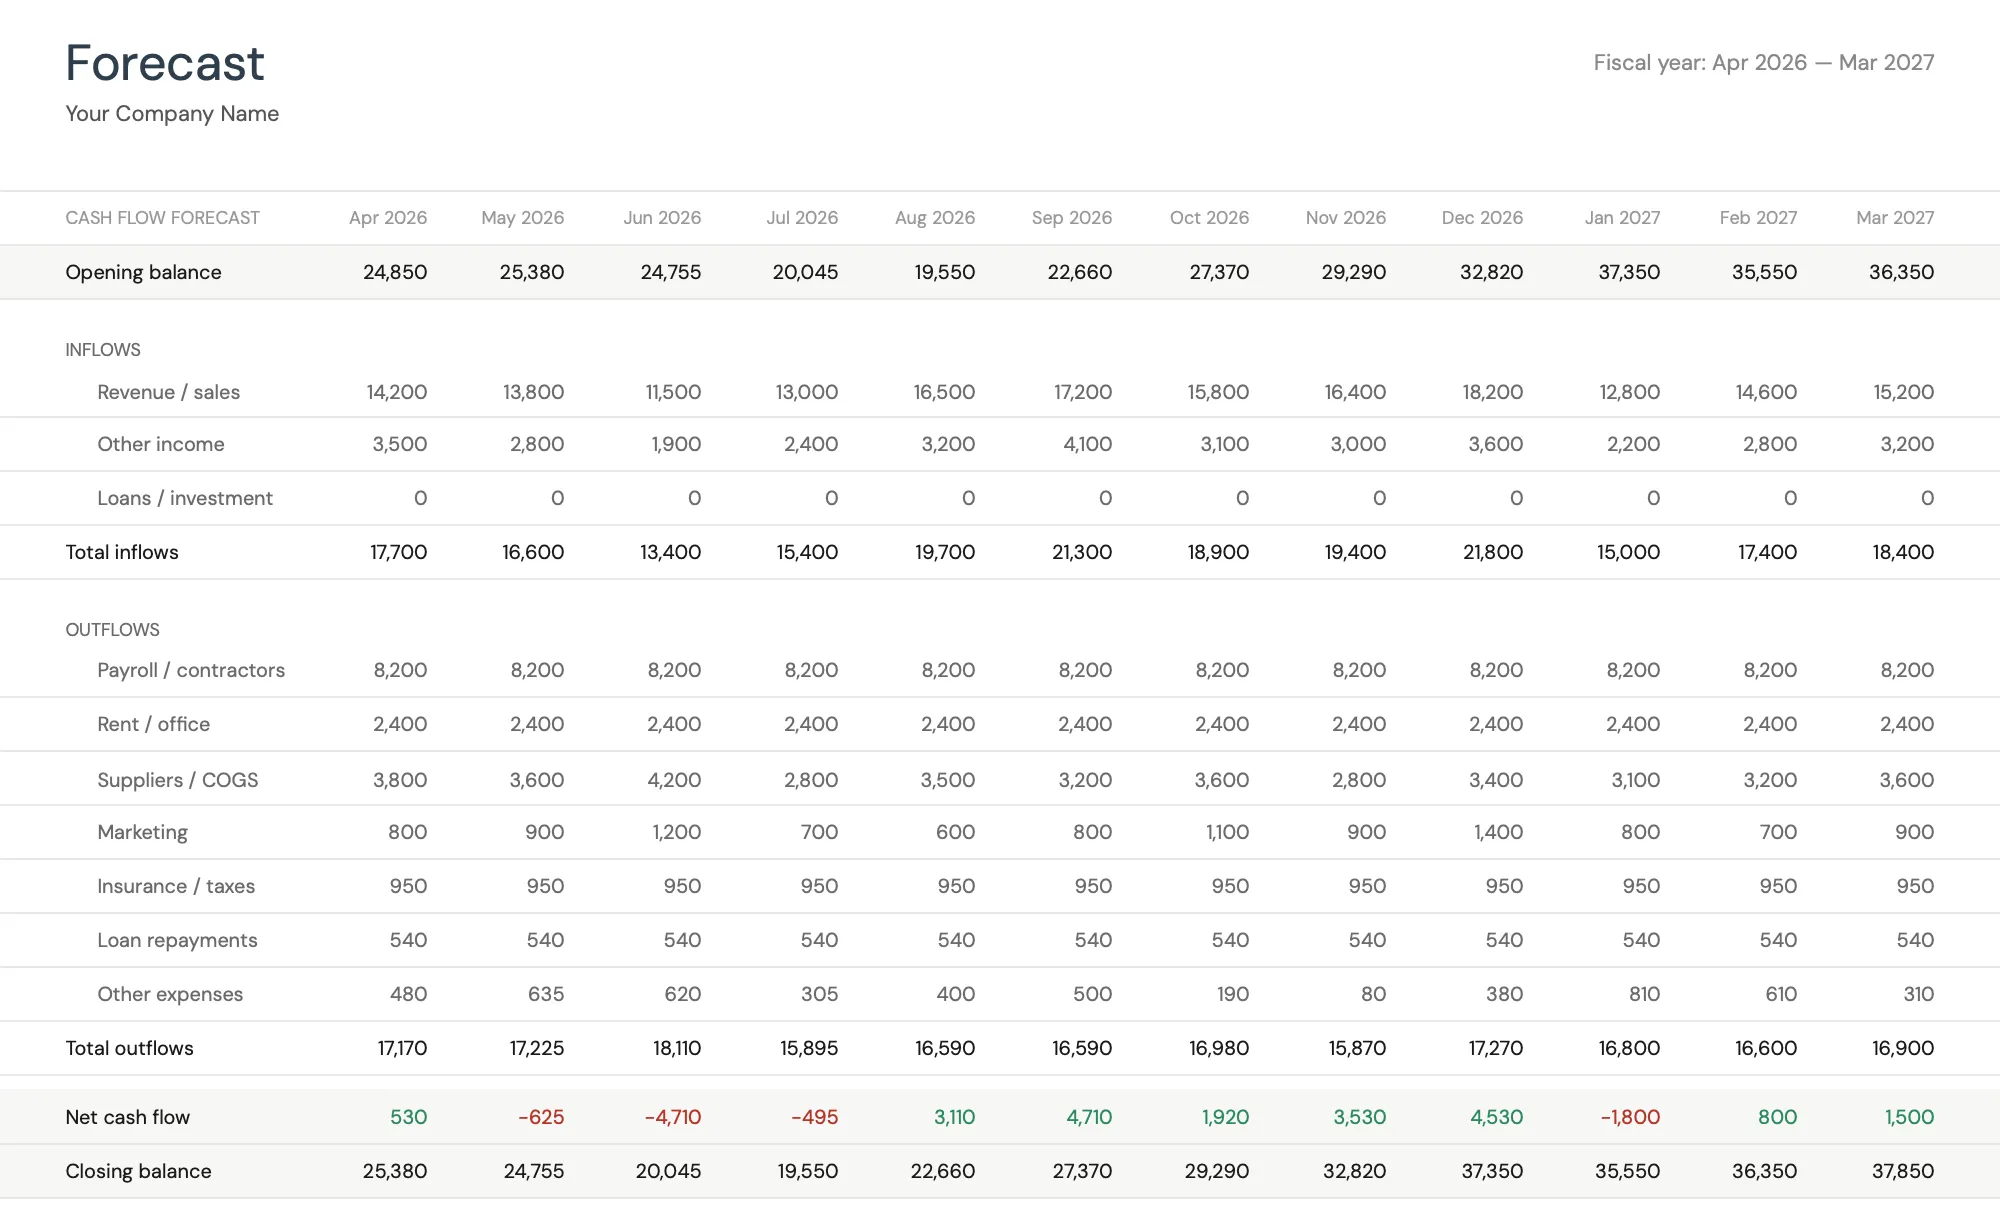
The Cash Flow Forecast template (Premium tier) builds this 12-month view automatically: the closing balance rolls into the next month’s opening balance, and net cash flow turns red the moment outflows outrun inflows.
Step 5: Check for Problem Months
Scan the closing balances. Any month where the balance drops near zero, or goes negative, is a potential problem.
In the example above, January and February show lower balances. That could be seasonal (post-holiday slowdown) and worth planning for - perhaps by building reserves in the stronger months of October and November.
Step 6: Add Running Minimum Balance
Some business owners add a row for a minimum cash threshold - the amount they want to keep available at all times. If the forecast shows the balance dropping below that threshold, it is an early warning to take action.
Cash Runway: How Long the Money Lasts
The closing balance answers where cash stands at the end of each month. Runway answers a sharper question: how many months until the money runs out at the current pace. It is the single number that turns an abstract worry into a specific deadline.
Start with net cash flow for each month, which is total cash in minus total cash out.
| Month | Cash In | Cash Out | Net |
|---|---|---|---|
| Jun | $22,500 | $26,500 | -$4,000 |
| Jul | $22,500 | $25,200 | -$2,700 |
| Aug | $23,500 | $25,800 | -$2,300 |
| Sep | $22,500 | $31,000 | -$8,500 |
| Oct | $19,500 | $27,800 | -$8,300 |
| Nov | $16,500 | $25,500 | -$9,000 |
Six straight months of negative net cash flow. On their own the monthly figures look manageable, but they accumulate. Running cumulative cash forward from an opening balance shows the real trajectory.
| Month | Net | Cumulative Cash |
|---|---|---|
| Start | $40,400 | |
| Jun | -$4,000 | $36,400 |
| Jul | -$2,700 | $33,700 |
| Aug | -$2,300 | $31,400 |
| Sep | -$8,500 | $22,900 |
| Oct | -$8,300 | $14,600 |
| Nov | -$9,000 | $5,600 |
| Dec | -$3,000 | $2,600 |
| Jan | -$1,000 | $1,600 |
At this pace the balance approaches zero within about eight months. If the minimum operating buffer is one month of expenses, roughly $26,000 here, cash drops below that line in September. That is the point the forecast flags for action, well before the account actually empties. Spotting it in the spring leaves room to accelerate the pipeline, trim expenses, or arrange a line of credit while there is still time to choose.
Scenario Planning
A single forecast shows one possible future. Scenarios show a range of them.
How to Build Scenarios
Take the base forecast and create two variations:
Expected Case - the main forecast, based on current trends and known commitments.
Conservative Case - reduce revenue by 15-25% and keep expenses the same. This shows how long cash reserves last if business slows down.
Optimistic Case - increase revenue by 10-20% and add the variable expenses that come with growth. This shows whether the business can fund its own growth or needs outside capital.
What Scenarios Reveal
| Scenario | Monthly Revenue | Monthly Expenses | Monthly Cash Flow |
|---|---|---|---|
| Conservative | $25,000 | $31,000 | -$6,000 |
| Expected | $33,000 | $32,500 | +$500 |
| Optimistic | $40,000 | $35,000 | +$5,000 |
In this example, the conservative scenario shows a $6,000 monthly cash drain. At that rate, a $20,000 reserve lasts about three months. That is useful information for deciding how much cash to keep on hand.
The gap between conservative and expected is also worth noting. If the business is close to breakeven in the expected case, the margin for error is thin. Some business owners find this view helps them decide whether to delay large purchases or build reserves first.
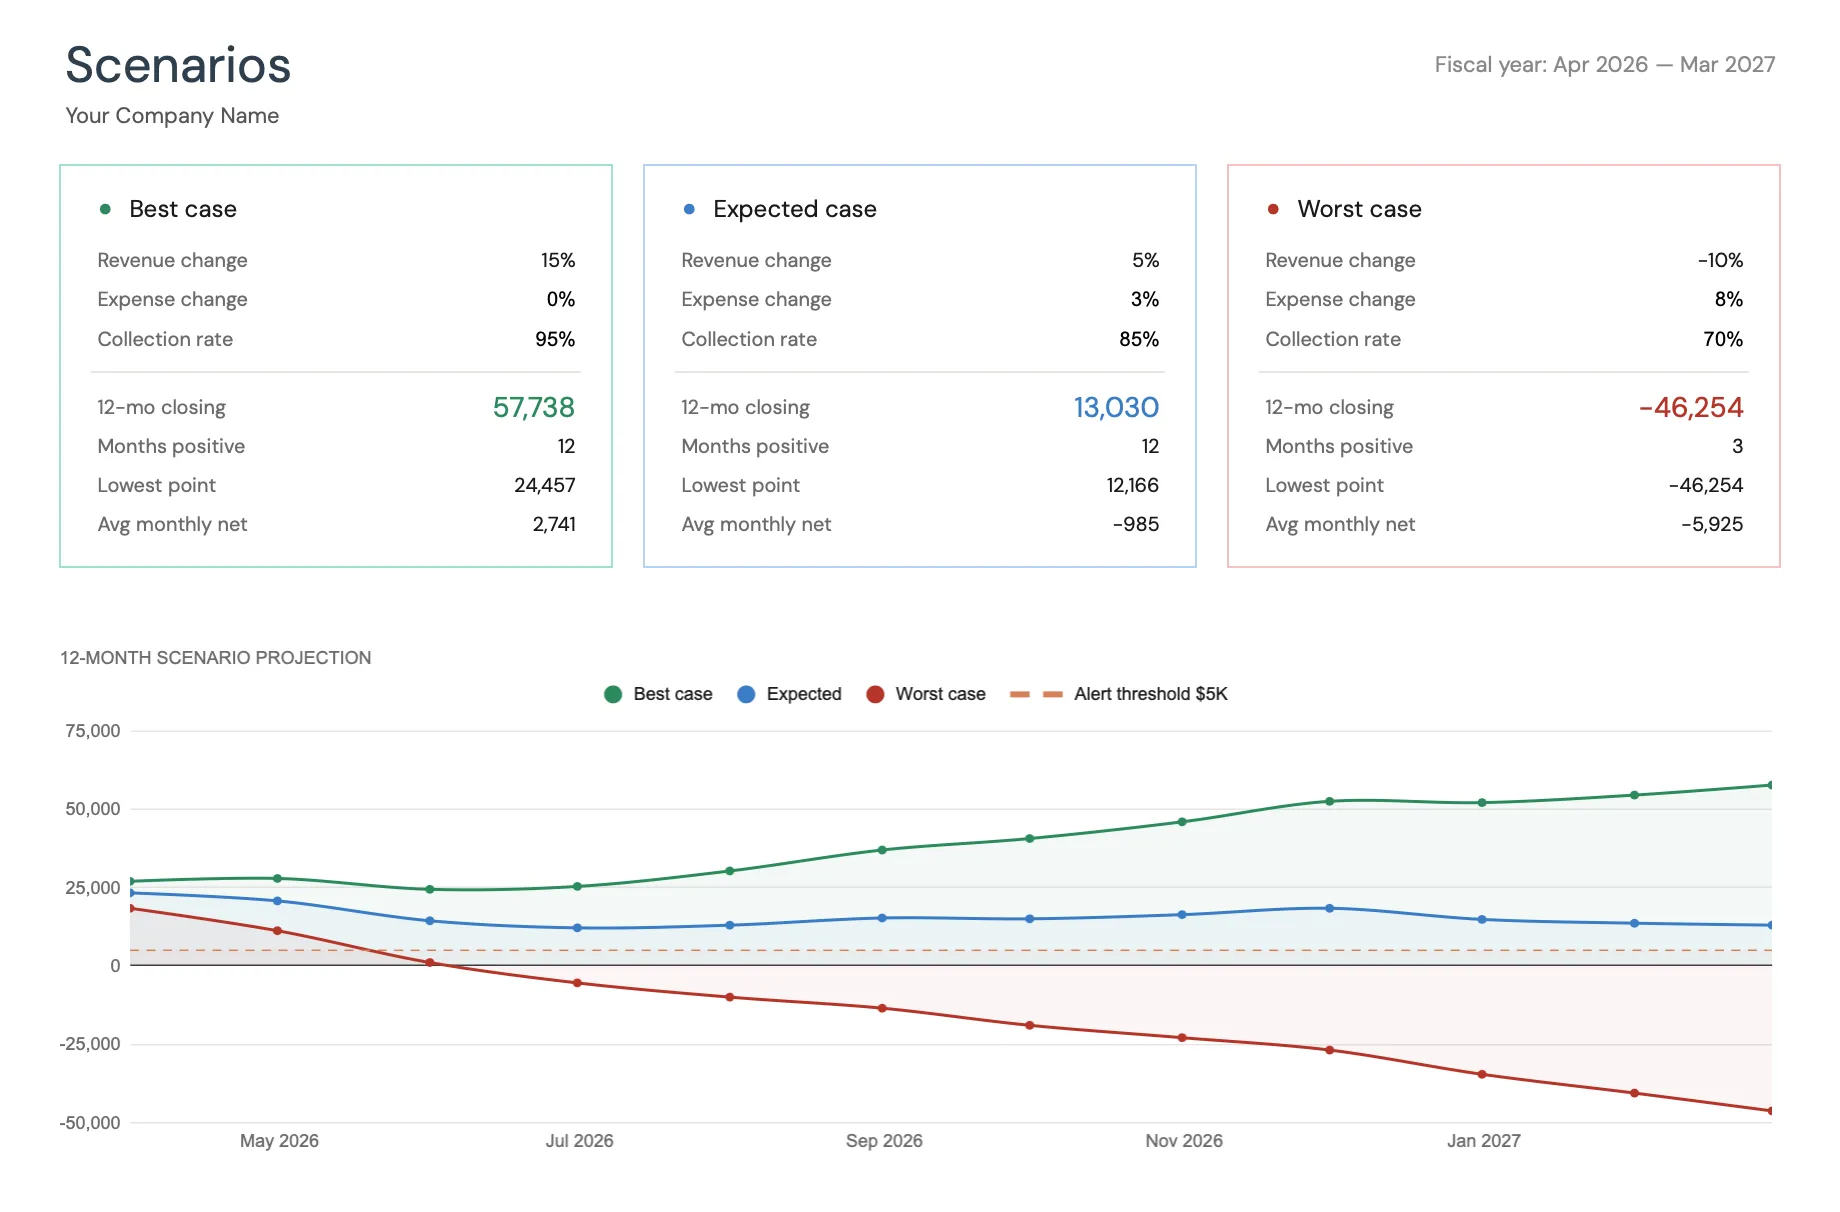
The Cash Flow Forecast template (Premium tier) runs the three cases side by side, each driven by its own revenue, expense, and collection-rate assumptions, and plots all three against an alert threshold on one chart.
Common Forecasting Mistakes
1. Being Too Optimistic on Revenue
The natural tendency is to project what the business hopes to earn, not what it is likely to earn. Using historical data as the baseline, rather than aspirational targets, tends to produce more reliable forecasts.
2. Forgetting Irregular Expenses
Annual insurance premiums, quarterly tax payments, equipment replacement cycles. These land in specific months and can cause cash crunches if they are not in the forecast.
3. Ignoring Payment Timing
Recording revenue when invoiced rather than when paid. For businesses with net-30 or net-60 payment terms, this can make the forecast look healthier than reality.
4. Not Updating the Forecast
A forecast created in January and never updated becomes fiction by March. Real data needs to replace projections as each month passes.
5. Confusing Cash Flow with Profit
Including non-cash items like depreciation, or excluding cash items like loan principal payments and owner draws. The forecast tracks cash movement only.
6. Missing Growth Costs
Revenue growth usually requires spending first - hiring, inventory, marketing. If the forecast shows revenue increasing without corresponding expense increases, it may be incomplete.
When to Update Your Forecast
A cash flow forecast is a living document. How often to update depends on the business, but some common rhythms:
- Weekly - for businesses in a tight cash position, some owners reconcile once a week, adding an actual figure beside each planned line for the current month and adjusting the rest of the month where the variance is meaningful
- Monthly - replace projections with actual figures for the completed month, then extend the forecast by one month to maintain the rolling 12-month window
- When circumstances change - a large new client, a lost contract, an unexpected expense, or a change in payment terms from a key customer
- Before major decisions - hiring, purchasing equipment, taking on debt, or expanding to a new location
- Quarterly review - compare original projections to actual results and adjust the methodology if patterns emerge
The monthly update is the baseline for most businesses. It takes 30-60 minutes and keeps the forecast grounded in reality rather than assumptions made months ago. Whatever the cadence, the value comes from comparing actual figures against the plan. A forecast that is never checked against what really happened tends to drift into fiction within a quarter.
The 13-Week Cash Flow Forecast
Most small businesses forecast month by month. Some, especially startups working from investor capital, use a 13-week rolling forecast instead. The structure is identical; the granularity is finer, showing each week rather than each month.
A weekly view tends to earn its extra effort in a few situations:
- Cash is within about six months of running out, so the timing of individual payments matters
- A near-term liquidity event is in play, such as a funding round, a sale, or a single large customer payment
- Cash flows swing sharply from week to week, as with lumpy enterprise contracts
Outside those cases, a monthly forecast usually captures enough and takes far less upkeep.
Every version of this, whether monthly, weekly, or 13-week, runs on the same four lines and the same habit of replacing projections with real figures as they land. The Cash Flow Forecast template has that structure, the scenario tab, and the runway math already built, so a first pass is mostly entering your own numbers into the model shown above.
Related
Frequently asked questions
How far ahead is it useful to forecast?
Twelve months is the standard for most small businesses. It covers seasonal cycles and gives enough lead time to plan for cash shortfalls.
What if the business is brand new with no historical data?
Start with industry benchmarks and known fixed costs. Be conservative on revenue, and update the forecast monthly as real data comes in.
How is this different from a budget?
A budget sets spending targets and tracks performance against them. A cash flow forecast predicts the actual cash position of the business at any point in time.
What tools work for cash flow forecasting?
Spreadsheets are the most common tool for small business cash flow forecasts. They offer flexibility to adjust assumptions, add scenarios, and see formulas.
How accurate does a forecast need to be?
A forecast within 10-15% of actual results is useful. The goal is to identify trends and spot potential problems early, not to predict the future precisely.
What is a good minimum cash reserve for a small business?
This varies by industry and business model. Some business owners aim for 2-3 months of fixed expenses. The forecast itself helps determine what level feels appropriate.
Should loan repayments and owner draws appear in a cash flow forecast?
Yes. Both move real money out of the account even though loan principal and owner draws do not show up as expenses on a profit and loss statement. A cash flow forecast tracks every dollar that enters or leaves, which is why its numbers can diverge from the P&L.
What does a negative closing balance in the forecast mean?
It signals that, under the current assumptions, the account would run short that month. Because a forecast looks months ahead, that warning usually arrives with enough lead time to adjust the pipeline, the timing of large costs, or spending before the shortfall becomes real.
Sources
- Estimated Taxes - Internal Revenue Service
- Small Business Credit Survey - Federal Reserve Banks
About this article
Forecast structure, scenario ranges, and cash runway figures reflect the 12-month model in the FinancialAha Cash Flow Forecast template. Quarterly tax timing checked against IRS estimated-tax guidance. Last reviewed August 2026.